8 Days Later: Italy vs. US

Otello Stampacchia, founder, Omega Funds (illustration by Praveen Tipirneni)
The following is an update to my article on March 10, also published on Timmerman Report. The initial article is available (free to read here).
Before I begin, I would like to sincerely thank everybody who has reached out with comments / feedback after my first article. Thank you also for the outpouring of well wishes for my family in Italy. So far, they are all safe and sound (though increasingly going stir crazy from being locked up in their homes: you should really see the videos going around our family’s social media. They are hilarious).
So: it’s been a bit more than a week since that note of warning. Where are we now?
Unfortunately, the daily situation in Italy has continued to worsen: as I write, Italy has had more than 31,000 confirmed cases and over 2,500 fatalities. This is a Case Fatality Rate (CFR) of ~8%. If any more proof was needed, this is not the flu. China, where the outbreak began, has had a total of ~81,000 cases and ~3,100 deaths. Italy is quite likely to surpass China’s fatalities shortly (it has almost as many fatalities after 21 days as China did after 35). Note Italy has a population of ~60 million, compared with a Chinese population of ~1.5 billion.
Of course, China led the crisis response by initiating drastic social distancing measures and testing, followed by quarantines among those infected, very early on. These draconian actions probably did save a lot of lives.
As shown in the chart below (from the FT), other European countries (UK, France, Spain) are more or less tracking a similar path to Italy. The Spanish situation is even more dire than Italy at a comparable stage. It is to be hoped than the severe quarantine measures which have been put in place will contribute to “bending the curve” back to reduce the death toll. There is no time to lose if we want to preserve hospital and healthcare system infrastructure to adequately care for the 15-20 percent of those infected who require hospitalization.
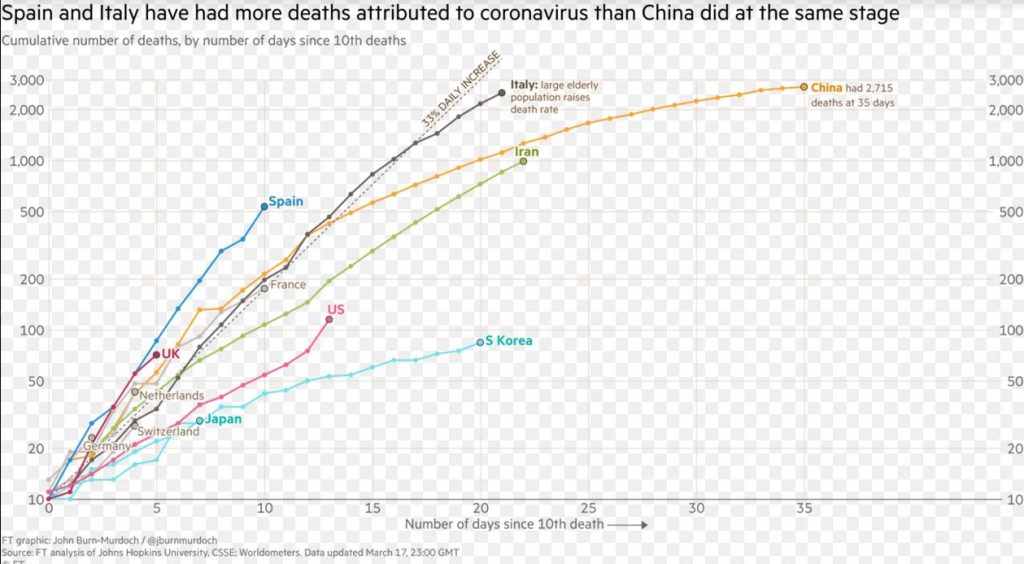
Also from the chart above, the US seemed (at least at the beginning) to be following a very different curve from European countries, at least so far: it appears almost as benign as South Korea (which has had an exemplary response to the virus and has managed so far to contain the outbreak and limit the number of fatalities). As I write, the US has had ~6,500 confirmed cases, with ~116 fatalities, for a CFR of ~1.8%. Considering the US has had very limited testing capacity online to date, this is remarkable. Note, however, the curve seems to be steepening, not bending down.
I can almost hear your thoughts: this is not THAT bad! We are winning this! We are almost as good as South Korea! (I knew I did not have to study math in high school…). Why are we worrying about this virus so much AND shutting down the entire economy?? I do not want to be stuck at home with my children all day!
I will argue below that this is not necessarily the case. We are NOT “winning.” Again, I do hope I am wrong. Please bear with me as this becomes a bit wonky below (and yes, you should have studied math in high school).
We Are All Living in the Future
This is an important point.
I think I know most of the people who read this newsletter: you are living in the now, avidly watching today’s news. And I assume, as readers of the Timmerman Report, that you are well informed and are up to date with the zeitgeist. Good for you. Sorry to disappoint your own self-esteem, but that is not necessarily accurate for this situation.
To clarify: it takes ~17 days from initial infection to death on average. Fatalities we see TODAY are people who were infected more than two weeks ago.
Today’s news (and the increasing level of panic in financial markets, our own social networks, etc.) is based on the equivalent of the information coming from the light from a star (17 light-days away, ~3.6*1011 km, roughly 100x farther away than Pluto, you can make your own conversion in miles if it is important to you). It was sent out 17 days or so ago. That star might as well have exploded since and you will only find out in 17 days (and what a great sunburn that will be).
Therefore, to recap, the fatalities reported TODAY are a snapshot of infections that happened THEN, not NOW.
Since then, remember the virus spreads exponentially, with an R0 (a measure of infection spreading, no need to get into that now) that is very high without social distancing measures. The R0 can be moved in a lower, more manageable direction with aggressive social distancing. But the US did not put those type of strong interventions in place until recently. And as of this writing, they don’t extend to every geography in the country.
One consequence of us living in the future is that, even if you start immediate, radical social distancing measures right NOW, the number of infections and fatalities reported will continue to climb for those ~17 days. Italy’s fatalities have grown almost 10-fold since northern Italy begun its quarantine.
Testing is (VERY) Important: Asymptomatic Carriers Contribute Massively to Spread
Let me introduce you to the small town of Vo’, in Veneto, West of Venice (Italy, not California). The town was in one of the initial cluster of cases in Northern Italy, and is close to the University of Padova, where there happens to be a great virology department, led by Prof. Andrea Crisanti.
The town’s mayor, may the fates be always in his favor, decided to test EVERYBODY in the town (~3,300 people). He tested them TWICE, at a distance of 10 days. In the first round of tests, ~3% of the town (~88 people) was infected. Asymptomatic carriers were the majority of infections detected (50-75%, I cannot seem to nail that number down from my Italian sources). Everybody infected, including asymptomatic carriers, were isolated (including from their own families). In the second test, 10 days later, the number of people infected had gone down to 7 from 88 (these were new cases who somehow had gotten infected in the intervening period). Now the town is virus free.
An article recently published in Science (Li et al., Science March 16, 2020, DOI: 10.1126/science/abb3221), using Chinese data, also broadly corroborates this finding. According to that article, ~86% of infections are estimated to be undocumented prior to the Jan 23 travel restrictions put in place. Undocumented infections (which for all intents and purposes we can understand to be asymptomatic, though that is not a 100% accurate assumption) seem to have a transmission rate of as much as ~55% of documented infections. However, because of their much greater number, undocumented infections were the source of almost 80% of documented cases!
What this means is that huge numbers of people – for practical purposes, let’s assume almost everyone you could potentially come into contact with over the course of a day – could be spreading the disease without even displaying symptoms.
This again validates the Chinese and South Korean approach of population-wide, massive rapid testing. Once cases are confirmed (and note that individuals are held in isolation away from hospitals and families, while tests are underway), the infected individuals are isolated (even if they aren’t displaying symptoms). Note that the information from Vo’, though on a small sample size, seems also to indicate that isolating infected individuals seems to prevent the disease from evolving into a severe state.
These experiences and data point to a very important lesson: there is a very direct trade-off between capability to perform lots of (rapid) tests and the need to impose radical social distancing to prevent healthcare system collapse. The more you frequently test AND isolate individuals infected (including asymptomatic spreaders), the lesser there is a need for radical social distancing.
Unfortunately, the U.S. did not heed this lesson from Korea (Japan did not perform extensive testing, but they did isolate their entire demographic of >70 year olds, thereby reducing the fatality rate so far). The lack of testing in the U.S. has contributed to possibly quite widespread community-based spreading.
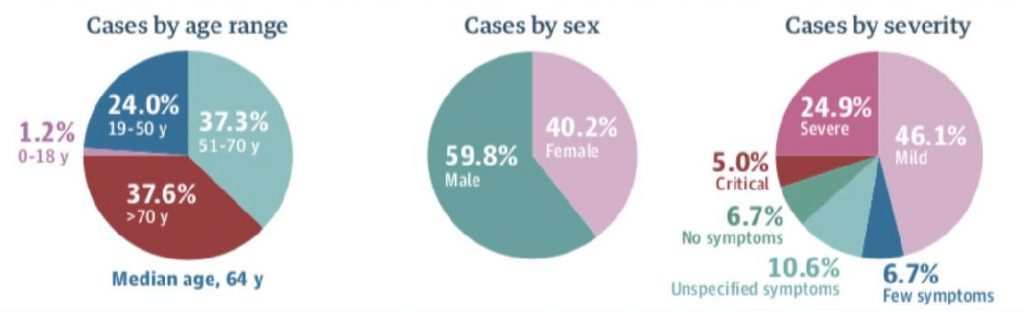
The implications of this are very broad, particularly for the young demographic in the U.S. population (the U.S. skews young, see below): your partying and drinking in bars and restaurants during St. Patrick’s Day is not helping here. Stay home. One case, early in the outbreak, infects ~2.5 people on average (many, many more if in close physical contact like at bars, dance parties etc. I would not know personally, I am a terrible dancer, but so I am told). ONE SINGLE CASE, under those assumptions, can lead to ~244 more cases in one month. If you halve that transmission, by reducing social contact, that single case only infects 4 people in that month.
Now is a good time to teach young people about exponentials before letting them go out in the evening.
Viral Load is Also VERY Important for Disease Severity
The latest news from Italy is that ~9% of the fatalities are healthcare workers. This is tragic. These individuals have been working selflessly for weeks now in conditions akin to a World War II conflict zone, performing triage on patients, without adequate supply of protective equipment and often in isolation from their own families.
It also seems to point out that it matters how much of the virus you are exposed to when you are infected. These heroes on the frontlines are exposed to high virus titers for long periods of time.
It makes sense: the lesser the number of copies the virus has infected you with to begin with, the more it has to replicate (and the longer that takes) before it overwhelms your immune system. Logically, if fewer copies of virus enter the body in the first place, that gives the immune system more of a chance to adapt to the invader and mount a defense.
So: wash your hands. Stay home. ESPECIALLY stay away from people at risk (immune-compromised cancer patients, people with co-morbidities, etc.). The government needs to step up manufacturing of protective equipment for healthcare workers ASAP.
Social Structure & Demographics Makes a Difference
So back to the graph above. Yes, I hear you thinking: your graph (it is not “my” graph, but whatever) says we are doing better than the Italians so far. Almost as good as the Koreans! I thought we were winning (everybody likes winning, I get it) and you have not provided me with any counterfactual. Am done reading this!
My, what an impatient bunch. Go watch some less complicated news channels (lots of choices there) and then come back when you feel like you want to discuss complex issues. This is important.
Differences in social interactions and social networks seem to play a very important role early on in the epidemic, especially when coupled with different demographic structures (huge thanks to Prof. Moritz Kuhn at University of Bonn for publishing on this, I really invite you to read his stuff, he is on Twitter at @kuhnmo).
Let’s start from the assumption that the virus was imported in Europe from mostly work-related travel. Different European countries are (very roughly) split in two categories: “A” countries, where grandparents do not live with their children and their grandchildren (France, Switzerland, Netherlands, Germany), and “B” countries (Italy, Spain) where there is a larger % of the population (close to 23% in Italy) in households with the three generations living together.
In “A” countries, the initial exposure of the elderly to the outbreak will be limited. This will lead to an increase in infections overall but with a reduced initial fatality rate (like we see now in Germany, and we saw earlier in France).
In “B” countries (sadly, Italy and Spain) the most at-risk demographics are exposed relatively early in the outbreak. This overwhelms hospitals sooner.
If I were to guess (remember, I am a recent guest to this country), the U.S. is an “A” country. So, I would assume that elderly demographics were less exposed early on at the population level.
In addition, the overall demographic skews much younger in the US. Have been trying to find graphs but I do have a day job. Trust me on this, Italy is overall a much older country (see all those monuments in Rome? Yes, current day Italians built those).
This factor probably helped reduce the initial fatality rate in the US. That is, until the epidemic has spread broadly enough that the cases reach more at-risk populations in the country.
This seems to explain the observation that infection growth rate (growth in nr of cases detected) in the US is actually higher than in Italy to date BUT fatalities are much lower to date (worryingly, starting to curve up).
When Hospitals are Overwhelmed, Fatalities Climb Rapidly
This is what worries me the most. See what is happening in Italy, Spain, look at the initial data from Indonesia, etc. etc.: all with CFRs exceeding 5-6%. As soon as hospital systems are overwhelmed, conditions resembling war zones start to apply and people who normally would have recovered in a healthy, functioning healthcare system are unfortunately not able to and perish.
We should not let that happen. Demographic and social structure have probably given us all a (short?) reprieve. Let’s use it productively.
Follow Otello Stampacchia on Twitter: @OtelloVC
This article expresses the personal views and perspectives of the author. The views and perspectives expressed here do not necessarily represent the views or perspectives of Omega Fund Management, LLC or any officer, director, partner, member, manager or employee of Omega Fund Management, LLC or any of its affiliated entities.
You may also like